XDA-Developers’ year-in-review of self-hosting FOSS tools made one thing clear: the operational nightmares aren’t the tools themselves, they’re invisibility. A container quietly restarts in a crash loop overnight, a disk fills up while nobody’s watching, a certificate expires and takes a service down, and none of it surfaces until someone actually needs the thing that’s broken. Self-hosting looks easy right up until the point where a failure is silent. The fix isn’t more software to babysit, it’s observability that surfaces problems before they become incidents. Seven desktop apps that make a home-lab stack watchable, ranked by how directly each one answers “is everything actually working.”
What to look for in a self-hosted monitoring app
- Resource footprint. A monitoring stack that eats a meaningful slice of the hardware it’s supposed to watch defeats the point on a small home lab.
- Alerting integrations. Discord, ntfy, Gotify, Slack, and webhook support matter more than a pretty dashboard nobody checks.
- Status-page publishing. A public or internal page you can point people to beats explaining an outage after the fact.
- Container-native support. Anything running Docker or Kubernetes needs monitoring that understands containers, not just hosts and ports.
- Historical retention. Uptime alone doesn’t explain why something broke; metrics history over days or weeks does.
- Setup friction. A tool that takes an evening to configure gets abandoned the first time it needs an update.
Quick comparison
| App | Best for | Platforms | Free plan | Starting price |
|---|---|---|---|---|
| Uptime Kuma | Fast uptime alerts and a status page | Linux, Windows, macOS | Yes, full app | Free |
| Grafana + Prometheus | Deep metrics history and dashboards | Linux, Windows, macOS | Yes, full app | Free |
| Netdata | Zero-config per-second host metrics | Linux, Windows, macOS | Yes, self-hosted tier | Free |
| Beszel | Lightweight multi-server resource tracking | Linux, Windows, macOS | Yes, full app | Free |
| Gatus | Git-managed status pages | Linux, Windows, macOS | Yes, full app | Free |
| Homepage | Single dashboard aggregating other tools | Linux, Windows, macOS | Yes, full app | Free |
| Portainer CE | Container-level health and logs | Linux, Windows, macOS | Yes, Community Edition | Free |
The apps
1. Uptime Kuma — Best for fast uptime alerts and a status page
Uptime Kuma is the tool most home-lab guides point to first, and it earns that spot. Point it at HTTP endpoints, TCP ports, DNS records, or Docker containers, set a check interval, and it pushes alerts through more than 90 notification integrations, including Discord, Slack, ntfy, Gotify, and plain webhooks. It also generates a public or private status page out of the same monitor list, so there’s one URL to check instead of guessing which service died.
Where it falls short: No resource or metrics graphing beyond response time and uptime history. Notification setup is per-monitor, which gets repetitive past a few dozen checks. No built-in log aggregation.
Pricing: Free, MIT license, self-hosted only.
Platforms: Linux, Windows, macOS (runs anywhere Docker runs; the dashboard itself is a browser app).
Download: GitHub
Bottom line: The fastest path from “nothing is watched” to “we’ll know within a minute.”
2. Grafana + Prometheus — Best for deep metrics history and dashboards
Grafana and Prometheus together are the industry-standard metrics stack, and they scale down to a home lab fine. Prometheus scrapes and stores time-series data from exporters attached to each service; Grafana turns that data into dashboards and alert rules. The exporter ecosystem covers almost anything worth watching: node_exporter for host stats, cAdvisor for containers, blackbox_exporter for endpoint checks.
Where it falls short: Two services to run and keep aligned instead of one. PromQL has a real learning curve. Every service you want metrics from needs its own exporter, which adds more moving parts that can themselves fail quietly.
Pricing: Free and open-source self-hosted (Prometheus is Apache 2.0, Grafana’s open-source edition is AGPL). Grafana Cloud offers paid hosted tiers, but the self-hosted stack stays free.
Platforms: Linux, Windows, macOS (native binaries or Docker on all three).
Download: Grafana · Prometheus
Bottom line: Pick this when uptime alone doesn’t answer “why,” and history matters.
3. Netdata — Best for zero-config per-second host metrics
Netdata auto-discovers what’s running on a host at install time and starts charting it immediately, no dashboard building required. It ships thousands of pre-built charts covering CPU, memory, disk I/O, network, and hundreds of supported applications, all at per-second granularity. For a single home-lab box, it’s the fastest way to see everything at once.
Where it falls short: Per-second local retention can fill disk fast on constrained hardware. The Netdata Cloud signup prompt shows up more than it needs to. Resource use is heavier than the lightweight competitors on this list when running on a low-power node.
Pricing: Free Community tier self-hosted; the paid Business tier adds centralized fleet management and longer cloud retention.
Platforms: Linux (native install and Docker, the primary target), Windows and macOS via Docker.
Download: GitHub · Netdata site
Bottom line: Install it and the host explains itself, no configuration required.
4. Beszel — Best for lightweight multi-server resource tracking
Beszel is what Netdata would be if it stayed minimal. A single static Go binary runs a hub that collects from lightweight agents on each server over SSH, charting CPU, memory, disk, network, and per-container Docker stats without the overhead of a full metrics stack. For someone watching three or four machines, it’s the tool that doesn’t ask for a second server just to run monitoring.
Where it falls short: Younger project, so fewer integrations and less community documentation than Netdata. No notification integration list as broad as Uptime Kuma’s. The feature set is intentionally narrower than a full metrics stack, by design.
Pricing: Free, MIT license, self-hosted only.
Platforms: Linux (primary, for both hub and agent), Windows and macOS via binary or Docker for the agent.
Download: GitHub
Bottom line: Pick this when Netdata feels heavy and Grafana plus Prometheus feels like overkill.
5. Gatus — Best for git-managed status pages
Gatus treats monitoring as configuration, not clicking. Every endpoint check, whether HTTP, TCP, DNS, ICMP, or a custom scripted condition against a response body or header, lives in one YAML file that can sit in version control alongside the rest of a home-lab’s infrastructure-as-code. It renders a status page from that same config, so the source of truth for what’s monitored and what the public sees are the same file.
Where it falls short: Editing a monitor means editing a file and reloading, not clicking through a UI. No resource or metrics graphing. The notification integration list is narrower than Uptime Kuma’s.
Pricing: Free, Apache 2.0 license, self-hosted only.
Platforms: Linux, Windows, macOS, via Docker or a static Go binary.
Download: GitHub
Bottom line: Pick this for a status page that lives in git, not a database.
6. Homepage — Best for a single dashboard aggregating other tools
Homepage doesn’t monitor anything itself; it pulls live status from the tools that already do and puts them on one start page alongside bookmarks and search. Widgets can show Uptime Kuma monitor states, Docker and Kubernetes container health, Proxmox host stats, and dozens of other self-hosted services side by side, so checking “is everything okay” becomes one page load instead of five logins.
Where it falls short: It displays health it pulls from other tools rather than generating its own alerts. Config is YAML files edited per widget, which adds friction for frequent changes. No historical charts of its own.
Pricing: Free, GPL license, self-hosted only.
Platforms: Linux, Windows, macOS, Docker-based with a browser dashboard.
Download: GitHub
Bottom line: Pick this as the single pane of glass that surfaces what Uptime Kuma, Netdata, or Portainer already know.
7. Portainer CE — Best for container-level health and logs
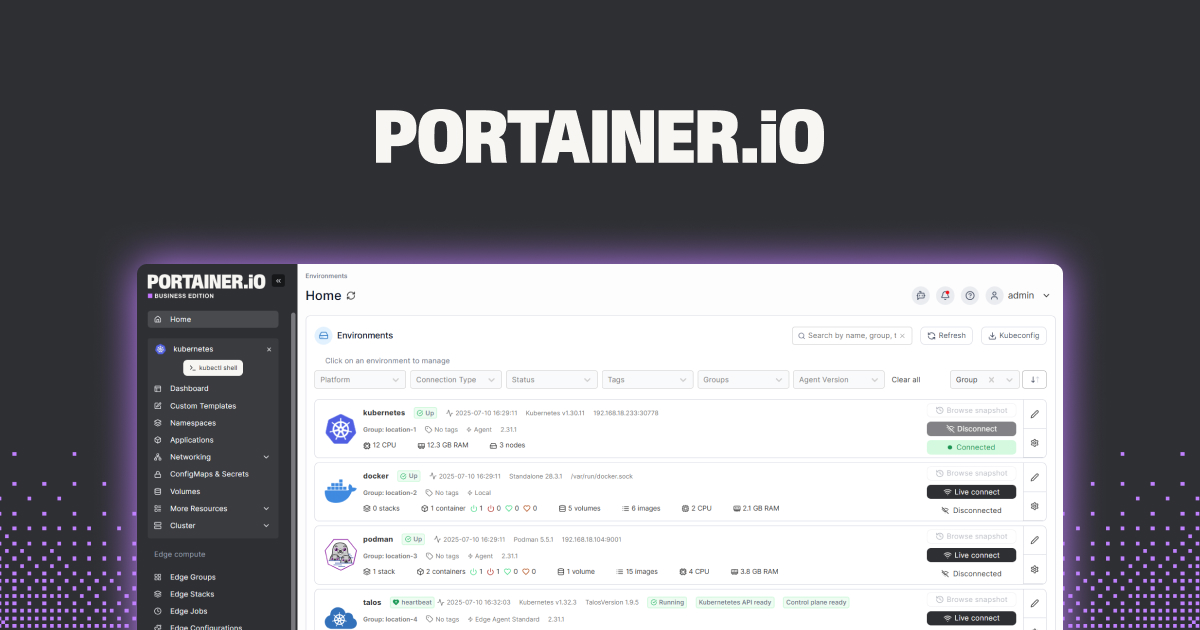
Portainer Community Edition gives every container its own view: live logs, CPU and memory usage, network stats, and restart or inspect controls, all from a web UI instead of a terminal. Stack management covers Docker Compose and Kubernetes, so a whole self-hosted stack can be checked, restarted, or redeployed from one place when something in a container silently died.
Where it falls short: Monitoring is container-scoped, not host-wide or endpoint-wide. No built-in alerting or notifications in the Community Edition; the paid Business Edition adds more. Historical resource graphs are limited compared to Grafana plus Prometheus.
Pricing: Free Community Edition (zlib license); Business Edition adds RBAC and support on a paid license.
Platforms: Linux (the most common Docker host), Windows via Docker Desktop or Windows containers, macOS via Docker Desktop.
Download: GitHub · Portainer site
Bottom line: Pick this when the failures worth watching are inside containers, not just at the edge of the network.
How to pick the right one
- If a home lab has nothing watched yet: start with Uptime Kuma. It’s the fastest setup and covers the most common failure, a service going unreachable.
- If uptime alerts aren’t answering “why did this happen”: add Grafana plus Prometheus for the metrics history behind the alerts.
- If a single box needs full visibility with no configuration: Netdata gives it in minutes.
- If Netdata feels too heavy for a Raspberry Pi or a handful of small VPS nodes: Beszel does the same job leaner.
- If the monitoring config needs to live in version control alongside everything else: Gatus.
- If the stack has grown past three or four tools and checking each one separately is the actual problem: Homepage ties them together.
- If Docker or Kubernetes containers are the layer that keeps silently failing: Portainer CE watches that layer directly.
- Most home labs end up running two or three of these together: Uptime Kuma for alerts, Netdata or Beszel for resource history, and Homepage to see it all at once.
FAQ
What’s the easiest self-hosted uptime monitor?
Uptime Kuma. A single Docker container gets HTTP, TCP, DNS, and container monitors running with a status page and notification integrations within minutes, with no separate metrics database to configure.
Do I need Grafana and Prometheus for a home lab?
Not to start. Uptime Kuma or Netdata cover most home-lab needs without the two-service setup. Grafana and Prometheus earn their place once uptime alerts alone stop explaining what actually went wrong, or when metrics need to be correlated across several services.
How does Netdata compare to Beszel?
Netdata auto-discovers and charts far more out of the box, at the cost of a heavier footprint and a cloud-signup prompt. Beszel does less by design, a lighter agent reporting core resource stats over SSH, which suits watching several small servers without adding overhead to any of them.
Can I get Discord alerts from Uptime Kuma?
Yes. Discord is one of more than 90 built-in notification integrations, alongside Slack, ntfy, Gotify, Telegram, email, and generic webhooks, configurable per monitor.
Does any of this work without Docker?
Most of these apps ship Docker images as the primary distribution, but Uptime Kuma, Netdata, Gatus, and Beszel all also offer native binaries or bare-metal install scripts for Linux hosts that skip containers entirely.
Which of these actually prevents the “silent failure” problem XDA described?
All seven address it, but from different angles. Uptime Kuma and Gatus catch a service going unreachable. Netdata, Beszel, and Grafana plus Prometheus catch resource exhaustion before it causes an outage. Portainer catches a container stuck in a crash loop. Running at least one uptime tool and one metrics tool together covers both failure modes.